Dear all,
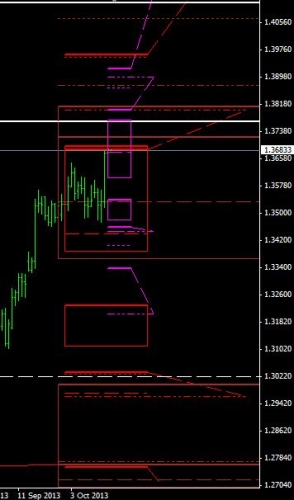
The graph below is snapshot of supports and resistances according to my System.
Each color represents a different timeframe. Similarly, each line style represents a different power and dictates different actions..
As it can be seen on the graph EurUsd is in a zone where price is constrained by lots of resistances.
As much as 1.3720-1.3810 resistance zone holds we should expect a pullback to 1.3550-1.3480 zone.
If prices can stay above 1.3820 then a journey to 1.4065-1.4250 zone should be expected..


