Gross Domestic Product
Definition:
In the US, the Federal Reserve's primary goal is to keep a sustained growth of the economy with full employment and stable prices. The information provided by the GDP index is a gross measure of the big economical picture. Representing the monetary value of all the goods and to signal services produced by an economy over a specified period, the real GDP is the most comprehensive measure of the country's production and it is indicative of inflation pressures.
To determine the GDP results, purchases of domestically-produced goods and services by individuals, businesses, foreigners
and government entities and the trade balance are routinely captured. In short, everything that is produced within the country’s borders is counted as part of the GDP. For this reason it's perhaps the broadest indicator of the well-being of an economy.
The published output is available in nominal or in realterms (also called index form), meaning increases in the the results due to
inflation have been removed. Analysts and traders usually monitor the real growth rates generated by the GDP quantity index or the real dollar value.
The nominal, current dollar, GDP corresponds to the market value of goods and services produced and it's calculated using today's Dollars. This makes comparisons between time periods difficult because of the effects of inflation. The real GDP, the index form, in turn, solves this problem by converting the current information into some standard era Dollar.

The GDP is typically lower than the consumer price index because investment goods (which are in the GDP price index but not the CPI) tend to have lower rates of inflation than consumer goods and services.
Why does it matter? GDP indicates the pace at which acountry's economy is growing (or shrinking). By monitoring trends in the overall growth rate as well as the rate of inflation and the unemployment rate, policy makers are able to assess whether the current stance of monetary policy is consistent with the goal of sustained growth.
Fundamental analysts and traders track important trends within the big picture using the GDP. Stronger GDP results in the current year compared to the previous year is seen as a positive indicator. Logically, if the value of a country’s production has raised, then a corresponding increase in employment and higher incomes will follow. This scenario, in turn, suggests that the domestic currency may increase in value compared to foreign currencies from countries with weaker economies. A higher value for a currency paves the way to an increase in its demand, right?
Conversely, an increase in inventories indicates that grow this slowing or consumer demand is weaker, and usually translates into a decrease in demand for the domestic currency.
The GDP can also be seen in a wider context. In many economies, borrowed money makes up a large percentage of spending. This means that GDP results will depend on how easy and cheap the general population can borrow money.
Under this perspective, when interest rates are expected to go higher, people will be expected to save and therefore spend less money, and economic growth will be expected to slow as a result. Conversely, when low interest rates make cheaper for people and businesses to borrow and spend money, economic growth will be expected to rise.
The major components of the GDP can be monitored separately as they all reveal important information about the economy. For instance, it is useful to distinguish between private demand versus growth in government expenditures. Typically, analysts and traders discount growth in the government sector because it depends on fiscal policy rather than on economic conditions.
Increased expenditures on investment are viewed favorably because they expand the productive capacity of the country. This means that the country can produce more without inciting inflationary pressures.
Particularly in the US, with imports typically exceeding exports, traders observe if the deficit becomes less negative, meaning a smaller amount is subtracted from the GDP, translating into more economic growth.In turn, when the deficit widens, it subtracts even more from the GDP.
Released by: US Department of Commerce; Bureau of Economic Analysis (BEA). Look for “News Release: Gross Domestic Product”.
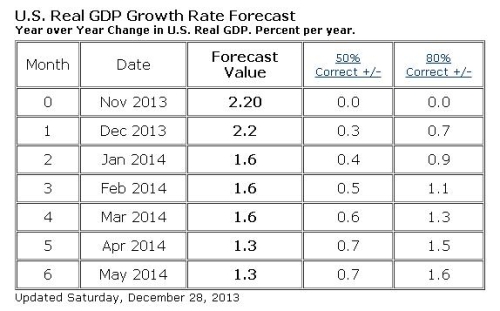
Frequency: It is usually measured annually, but quarterly statistics are also released in the last week of January, April, July and October. The US Commerce department revises the GDP twice before the final figure is settled upon: an advance report is followed by a preliminary report and later a final report is published, covering the previous quarter's data. Quarterly results are subject to some volatility, so it is appropriate to follow year-over-year percent changes in order to smooth out this variation.
The first or “advance estimate” is released during the final week of the month immediately following the end of a calendar quarter. Within a month it is followed by the "preliminary report" and then the "final report" is released another month later.
Significant revisions to the advance number can move the markets.
Annually, benchmark data and new seasonal adjustment factors are introduced in the second half of the year, usually in July. This revision affects at least three years of data. The magnitude of the revision is generally moderate and makes the short-term use of the report rather difficult. Nonetheless, it has an impact on the immediate currency value.
Economical Indicators will continue on next blog.
Visit and comment my article :
The Art of Ichimoku

