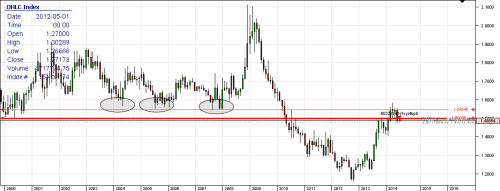
Looking at the charts today I noticed something that caught my attention. In this post I will try to share my idea with You. First I want to draw Your attention to EUR/AUD monthly chart to see the overall picture.

We can clearly see that last move up has been a correction .It has made a higher high kind of tricking traders into buying. It happens so often before the price drops significantly. There is also a solid resistance at this area marked with ellipses. Price also went back down below 1.50 - significant psychological level. Ok, let's move on to weekly chart and see if we can get some more clues.
What we can see here is that price had formed a diamond top - a powerful reversal pattern. Price has already moved below the last support at 1.50. However this area is still a concern as price often tends to stay a bit longer around the round numbers like this. But if we look from a monthly chart then it is normal that price goes 1000 pips pass the level before reversing. What gives more credibility that this move will continue is that trend line was broken and 1.50 level didn't hold a support or at least didn't show much signs of buyers stepping in. To pinpoint the entry take a look at the chart below.
On daily chart it is obvious enough that price had formed a H&S pattern unlike diamond top on weekly chart. But that just depends on how we look at it, the concept is the same. To the point. Last week we had a breakout below the neck line and so far this week price action has been very weak potentially signalling lack of appetite from the buyers. Price also went through 1.50 level pretty smoothly and didn't touch that level for 5 days. Putting it all together I think that this current situation is worth considering. however often times when things look too good it is just a trap.

