A Simple Way to Scalp Forex Market
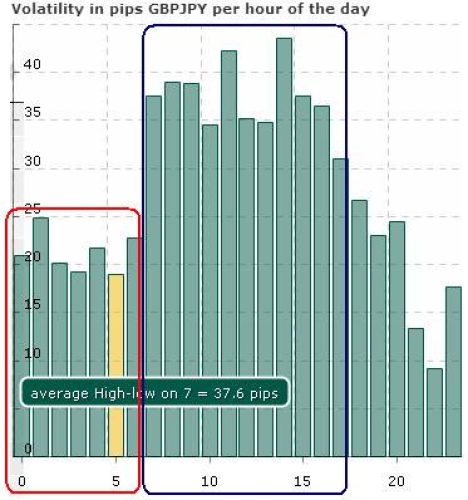
Practice Volatility
I want to show you how my system work .
If the price of Forex moves up and down rapidly over short time periods, it has high volatility ,breakout followed by
trend . If the price almost never changes, it has low volatility ,sideway or contraction .
For volatility we have many sites which offer graphic charts on hourly dayvolatility and for weekday .
Usually I don’t trade on Monday ,it is the worst day of the week,but everyone will decide for himself .
Let’s watch these charts :
Graphic chart
Spot chart :
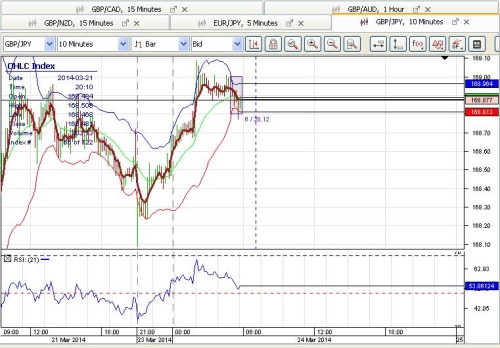
I think the price will breakout at about 7:00 GMT.Blue doted lines 7:00 .But is a probability ,nobody can guarantee 100% .
One more graphic chart
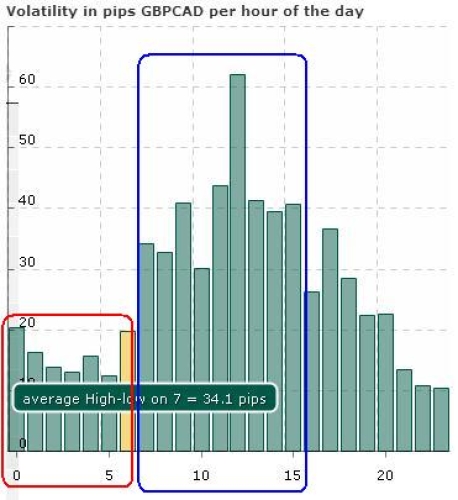
Spot Forex :
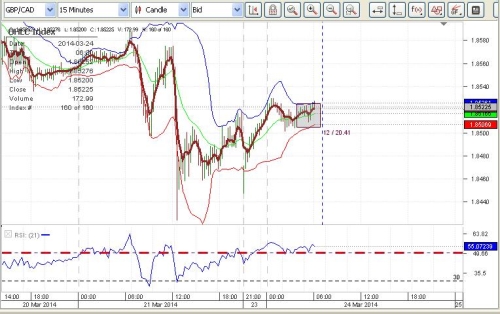
Blue doted line is 7:00 .
And the last one :

Spot Chart :
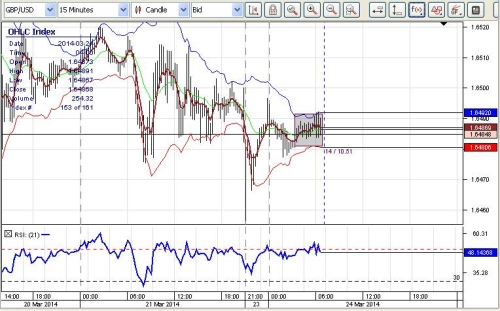
I just want to show you how my system work .Time frame 5,10 or 15min,where we have a clear view of squeeze (contraction area) .
Best Regards

