I lost some time from my order start,I wrote,I make some pictures and time is past. Example : I chose GBP/CAD .Why ? Look at this contraction area : Why GBP/CAD ? Let’s see next graphic charts :

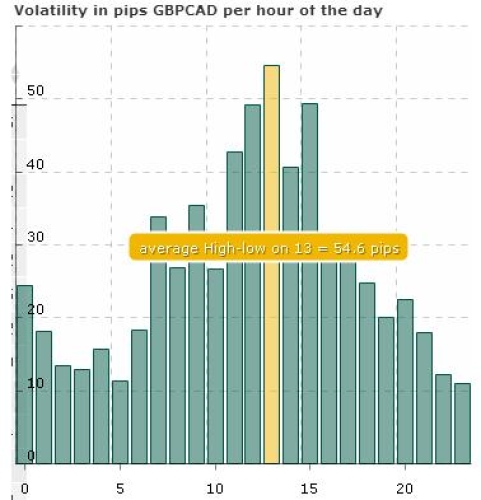
Yellow bar is current time 13:00 GMT .
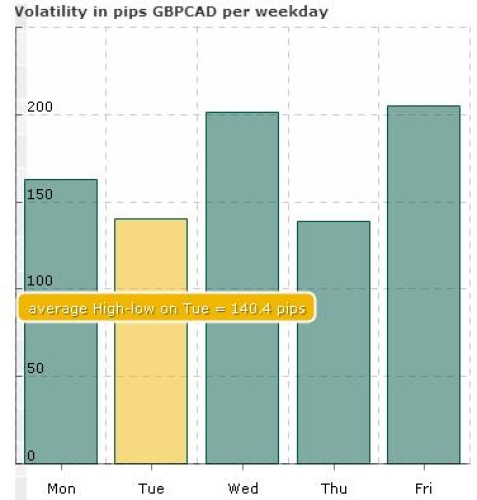
And next pictures is for weekday .

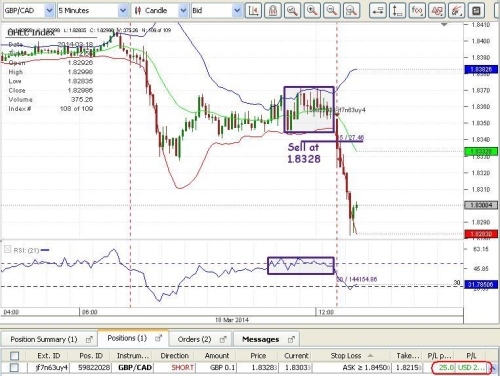
Finally ,the price chart:

I stopped my order at 25 pips ;this pattern of contraction I can find 2 times at list .
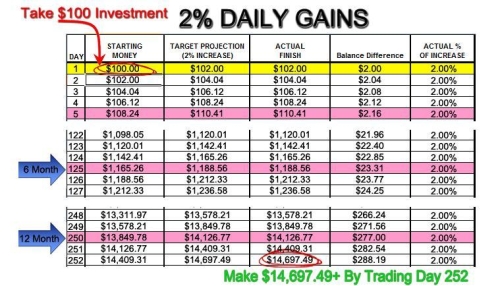
Look at pictures below to see what we can win with small amount of pips:

Let’s say we start with 1,000 USD ,not 100 .

And so on.
Best Regards
A Simple Way toScalp-Analysis-Live
I lost some time from my order start,I wrote,I make some pictures and time is past. Example : I chose GBP/CAD .Why ? Look at this contraction area : Why GBP/CAD ? Let’s see next graphic charts :

Yellow bar is current time 13:00 GMT .
And next pictures is for weekday .

Finally ,the price chart:

I stopped my order at 25 pips ;this pattern of contraction I can find 2 times at list .
Look at pictures below to see what we can win with small amount of pips:

Let’s say we start with 1,000 USD ,not 100 .

And so on.
Best Regards

