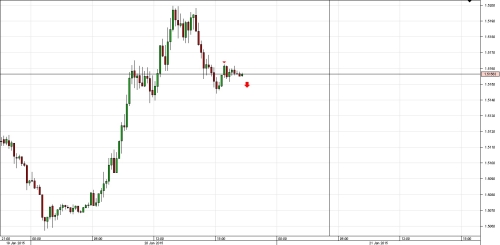
GBP\USD is in the process of forming a head and shoulders pattern in a 15M chart. I'm actually on that trade hoping it is going to go down to at least 1.5057 level and possibly it will break that support.
We rarely see such clear chart formations.

I just hope it will fully develop. It could illustrate a Forex text book.
Have a look for yourself!
We rarely see such clear chart formations.

I just hope it will fully develop. It could illustrate a Forex text book.
Have a look for yourself!

