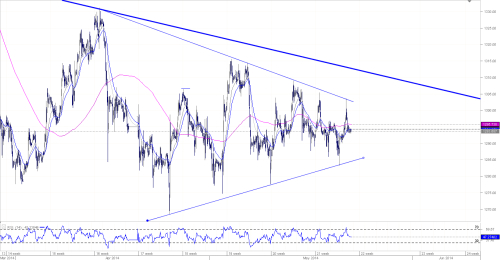
In my last post I showed the Bollinger Band setup for Gold. It shows price compressing which usually means a breakout will follow.
Here is my Daily Elliott Wave count on Gold. I presented this to viewers of my Dukascopy webinar about a month ago. It looks like we can see a breakout any moment now.

The longer term view as per the chart is a large triangle consolidation which forms the (B) wave of wave (Y) the final wave down in Gold. Targets for this setup can reach as low as 800 or conservatively 1050. Once the breakout progresses, targets should be more clear. This larger daily triangle also has another triangle within it. Please take a look at the chart below.

The above chart is a 1 hour view. as you can see there is a triangle within the triangle. A common occurrence.
Triangles usually end with a thrust to break out of the triangle. It is accompanied with heavy volume and momentum.
As an alternate count, in order to keep the view unbiased, this could be setting up as a bullish triangle. Either way, a close above or below either trendline will confirm the direction, and either validate or invalidate this viewpoint easily.
In short, there should be a very big move in Gold that will be making headlines.
Here is my Daily Elliott Wave count on Gold. I presented this to viewers of my Dukascopy webinar about a month ago. It looks like we can see a breakout any moment now.

The longer term view as per the chart is a large triangle consolidation which forms the (B) wave of wave (Y) the final wave down in Gold. Targets for this setup can reach as low as 800 or conservatively 1050. Once the breakout progresses, targets should be more clear. This larger daily triangle also has another triangle within it. Please take a look at the chart below.

The above chart is a 1 hour view. as you can see there is a triangle within the triangle. A common occurrence.
Triangles usually end with a thrust to break out of the triangle. It is accompanied with heavy volume and momentum.
As an alternate count, in order to keep the view unbiased, this could be setting up as a bullish triangle. Either way, a close above or below either trendline will confirm the direction, and either validate or invalidate this viewpoint easily.
In short, there should be a very big move in Gold that will be making headlines.

