 Open trading account
Hello ! i took 3rd place in November strategy contest and i used a very simple strategy . i like to trade on rebounds not in the rally trends so the strategy i used based on searching for overbought and oversold areas to enter and scalp some quick pips from the rebounds and i used just two popular indicators that can identify the overbought and the oversold areas :
1- Bollinger Bands . period 20 shift 0
2- relative strength index . period 7
i found this setting is the best for scalping on 5 minutes charts and the CURRENCY PAIR : eur/jpy because the pair have a good volatility . the lot size depend on the risk management i have two versions using the medium risk 5 Million lot size as a default in ver1 and the high risk 10 Million lot size in ver 2
when a powerful trend appear on the chart and the price start to move sideways i use the high risk version because this strategy works very good with the side ways moves and that's what i used on eur/jpy last month.
chart with the used indicators:
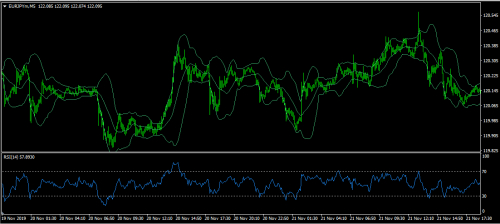
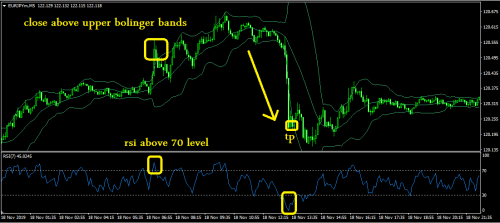
Sell: If Last Bid Candle Close above upper Bollinger Band and the relative strength index above level 70 It trigger a sell order since it is believed that the currency is overbought and i don't use take profit or stop lose the trade close when the opposite conditions appear on the chart .
chart with sell order:
Buy: If Last Bid Candle Close below lower Bollinger Bands and the relative strength index below level 30 It trigger a buy order since it is believed that the currency is oversold and i don't use take profit or stop lose the trade close when the opposite conditions appear on the chart .
chart with buy order:

that's all thank you
1- Bollinger Bands . period 20 shift 0
2- relative strength index . period 7
i found this setting is the best for scalping on 5 minutes charts and the CURRENCY PAIR : eur/jpy because the pair have a good volatility . the lot size depend on the risk management i have two versions using the medium risk 5 Million lot size as a default in ver1 and the high risk 10 Million lot size in ver 2
when a powerful trend appear on the chart and the price start to move sideways i use the high risk version because this strategy works very good with the side ways moves and that's what i used on eur/jpy last month.
chart with the used indicators:

Sell: If Last Bid Candle Close above upper Bollinger Band and the relative strength index above level 70 It trigger a sell order since it is believed that the currency is overbought and i don't use take profit or stop lose the trade close when the opposite conditions appear on the chart .
chart with sell order:

Buy: If Last Bid Candle Close below lower Bollinger Bands and the relative strength index below level 30 It trigger a buy order since it is believed that the currency is oversold and i don't use take profit or stop lose the trade close when the opposite conditions appear on the chart .
chart with buy order:

that's all thank you