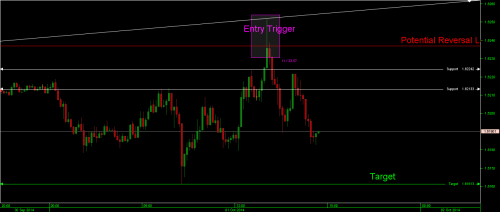
As we see in the first chart we have a downtrend followed by a correction in shape of channel. Price then goes through the supporting trend line of this channel and also through both support levels. The often used method here would be to go short and place the stop just above the breakout candle. It clearly must have happened in this case too. Sellers didn't manage to send the pair lower, instead it reversed to take out those stops. This is H1 chart which is used as an anchor chart or main chart.

Then I have a 15 min chart for entry. In this case we have too much of coincidence. Price even touched the trend line almost to the tick. As an entry trigger I had an inside bar formation at the level of potential reversal. It is the level where stops had been placed by other sellers. Target - previous low of anchor chart.


Then I have a 15 min chart for entry. In this case we have too much of coincidence. Price even touched the trend line almost to the tick. As an entry trigger I had an inside bar formation at the level of potential reversal. It is the level where stops had been placed by other sellers. Target - previous low of anchor chart.


