A Simple Way toScalp-Analysis Example : I chose GBP/AUD .Why ? Look at this contraction area :
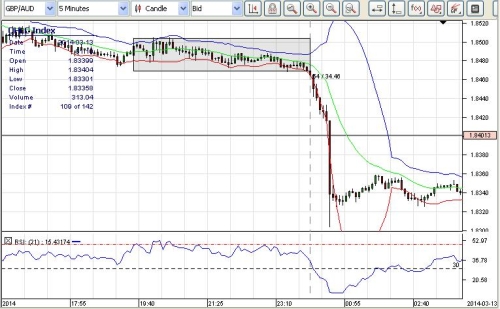 Is not clear on 5 min, I will see on 10 min:
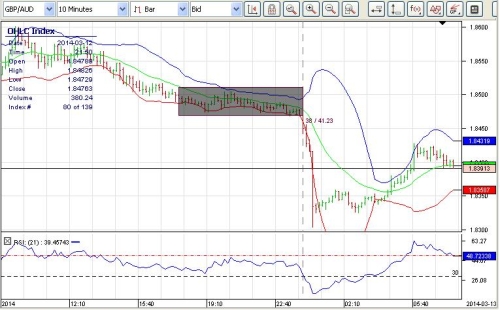
I still not convinced, I will try on 15 min:
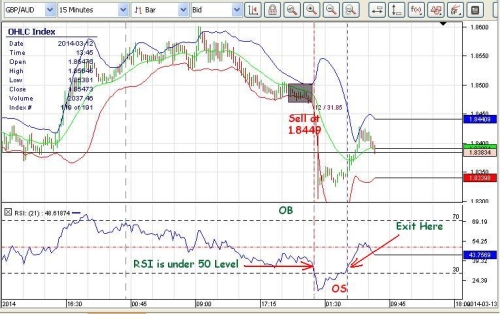
Here is OK.
Maybe all of you have some questions:
1.How I chose GBP/AUD ?
2.Why GBP/AUD ?
Let’s see next graphic charts :
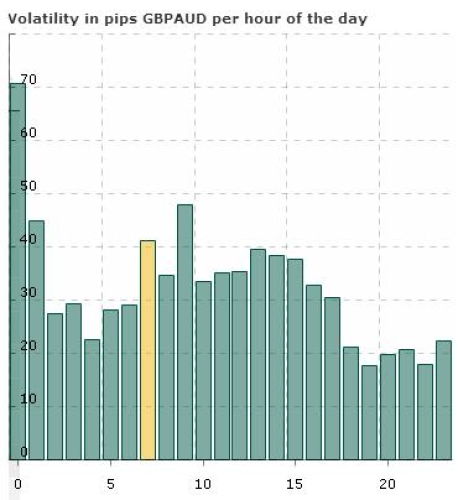
This hourly chart show us strong move on first 2 hours of the day( 0 and 1 GMT) and we have contraction area before this strong move, sure we can try .And we have good volatility on daily chart too.
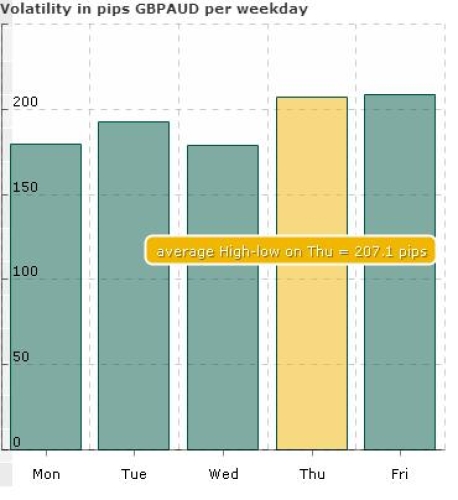
207.1 Pips for Thursday ,good volatility.
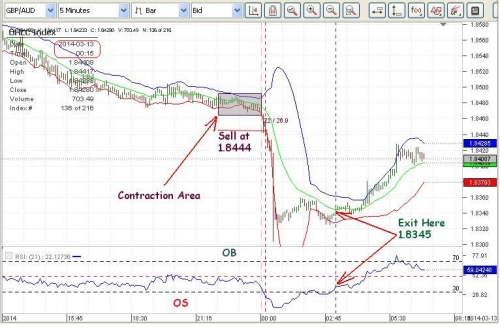
I come back on 5 min chart.
Picture from above show us exactly what to do :
Enter at 1,8449 with Market Sell Order, at 10 pips from lower side of contraction rectangle .RSI ( set at 21) is under 50 level .Price go down in Oversold (OS) area. When the price cross up 30 level from OS ,we stop this order.
So ,if we have a contraction area, a strong move of pips and an open time session, is time to hunt some pips .
Here is my article
Good Hunting.
 Is not clear on 5 min, I will see on 10 min:
I still not convinced, I will try on 15 min:

Here is OK.
Maybe all of you have some questions:
1.How I chose GBP/AUD ?
2.Why GBP/AUD ?
Let’s see next graphic charts :

This hourly chart show us strong move on first 2 hours of the day( 0 and 1 GMT) and we have contraction area before this strong move, sure we can try .And we have good volatility on daily chart too.

207.1 Pips for Thursday ,good volatility.

I come back on 5 min chart.
Picture from above show us exactly what to do :
Enter at 1,8449 with Market Sell Order, at 10 pips from lower side of contraction rectangle .RSI ( set at 21) is under 50 level .Price go down in Oversold (OS) area. When the price cross up 30 level from OS ,we stop this order.
So ,if we have a contraction area, a strong move of pips and an open time session, is time to hunt some pips .
Here is my article
Good Hunting.

