A Simple Way to Scalp Forex Market-Live Analysis
The relative rate at which the price of a security moves up and down. Volatility is found by calculating the annualized standard deviation of daily change in price. If the price of a stock/currency moves up and down rapidly over short time periods, it has high volatility. If the price almost never changes, it has low volatility.
Forex VOLATILITY
The following table represent the currency's daily variation measured in Pip, in $ and in % with a size of contract at $100'000. You have to define the period to calculate the average of the volatility. It could be interesting to trade the pair which offer the best volatility.
Formula : Variation = Average (Higher - Lower)
Volatility calculated over the last 10 Weeks in my graphic charts.
First step is to see which pair have good volatility that day and the hours with best volatility .
Everyone can do that.We only need to watch a few pair daily.
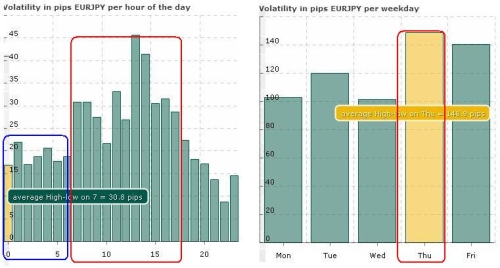 Figure.1
In figure nr.1 ,EUR/JPY,we have a good volatility which start at about 7:oo GMT
We don’t know where the price go, up or down. I don’t knowexactly, this is not a japanese train, but with Volatility and Correlations we are closer the true.
On the chart I used Bollinger Bands , RSI set at 21,and 5 Ema (5Ema is a suggestion of DumbAsArock and is not bad)
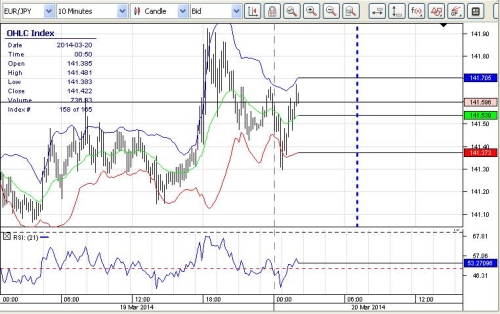
Figure.2
In picture nr.2 we will watch the price at 7:00 GMT
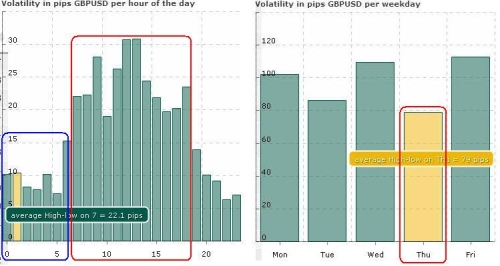 Figure.3
Here,in picture nr.3 ,GBP/USD, we watch also at 7:00 GMT which is Frankfurt session open.
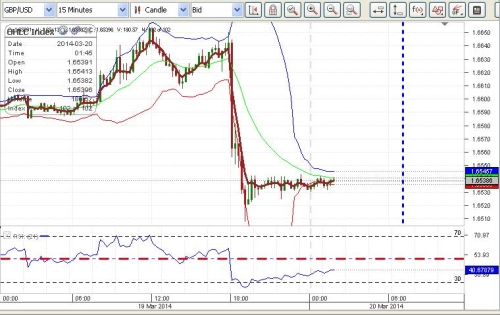 Figure.4
GBP/USD has today low volatility ,but I watch it
And finally GBP/AUD
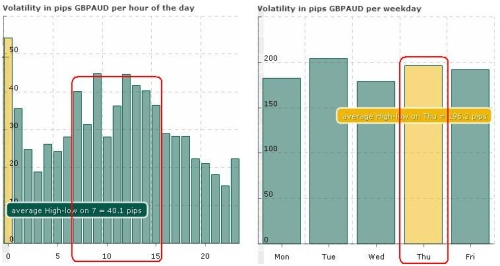
Figure.5
Here again I think trend will start at 7:00 GMT .I’m not a wizard,but I try to read the market.
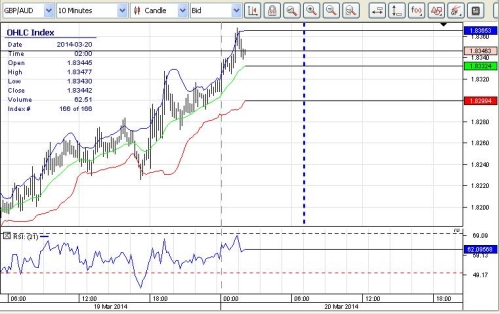
Figure.6
I will be back at about 7:00 ,or maybe later ,now my clock is 5:02 GMT+2
Best Regards

