Hello guys, this is my first post. Today I wanted to talk about the oil and see if we share the same vision bullish.
COT
From the point of view of the COT, the situation has not changed for weeks, big investors are continuing to believe in a rise in oil prices. In fact, both from a point of view of Cot Index and both from the point of view of the Net Position we both indicators on maximum.
The terms of graphics
We pass on to a graphical point of view with regard to the oil, and we analyze the three time frames of reference.
MONTHLY (MONTHLY)
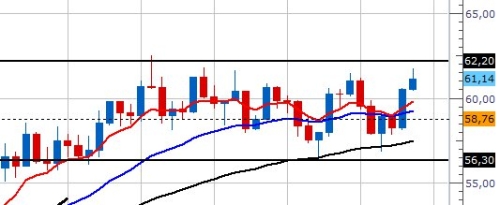
After the huge upside we had in April, the race appears to have halted oil beginning to fluctuate between $ 61 and $ 56 a barrel. Last month we had a nice bullish signal, but unfortunately not supported by volumes and in fact this month the price is really doing so much effort to break the resistance.
RSI and MACD are clearly on the upside, the faster moving average is currently below the price, therefore, begin to be there all the signals for a reversal of the uptrend.
WEEK (WEEKLY)
On this time frame we are going to confirm what we said in the previous time frame.
DAILY (DAILY)
On this time frame we can see in detail what was and is happening on a monthly, or the price that continues to oscillate on the resistance and the support mentioned a moment ago. I think that the wait will be the oil weapon in most of the traders, since you have to wait some news or some information which might give strength to the price break decisively resistance.
Even on the day we have the same situation that we had with regard to the monthly indicators, in fact, both the MACD and RSI as well as the exponential moving averages are oriented upward.
I on this matter before I am positioned long, because I believe in a rise in oil prices up to $ 72 area.


