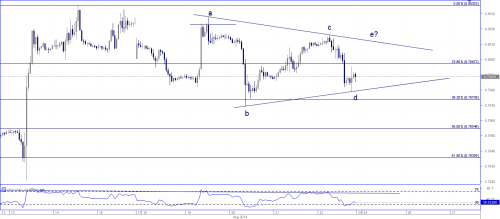
I've been following the EURGBP closely since last week, and have had a few short positions. On Friday we saw buyer's stepping in at the .7978 level which I found to be unusual. This price action leads to me to believe we may be in a potential triangle in the pair.
Take a look at the chart below.

If price remains above the .7978 level (marked d on the chart) and makes a move upwards towards the upper trendline of the triangle, this pattern would be in play. Keep in mind the e wave can slightly exceed the trendline or fall short of it, and often does.
Invalidation to the upside is a breach of wave c @.8016
Take a look at the chart below.

If price remains above the .7978 level (marked d on the chart) and makes a move upwards towards the upper trendline of the triangle, this pattern would be in play. Keep in mind the e wave can slightly exceed the trendline or fall short of it, and often does.
Invalidation to the upside is a breach of wave c @.8016


