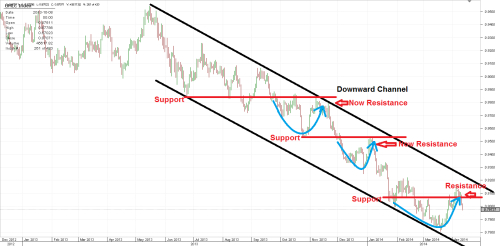
I've been posted this analysis in Technical Analysis Contest as well but I thought it has great potential to turn into a nice trade so I'm sharing my analysis here as well: CAD/CHF Downward Channel
Over the last several year CAD/CHF trend has been very consistent and we have been moving in a downward channel without any kind of deep retracement which shows the fact that this bearish trend is very strong and current price action doesn't suggest that there are many big support level that can stop this bearish trend. I'm still expecting this trend to press lower and to retest the all time swing low level at 0.7100.
In Figure 1 we have the CAD/CHF weekly chart where we can visualize how sloped this down move has been especially during last year. There are still more than 800 pips until we reach the last swing low. We can also see that this down sloped move only accelerate after we broke the red line, 0.9400 level which was a strong pivot point acting as both resistance and support level in the past.


Best Regards,
Daytrader21
Over the last several year CAD/CHF trend has been very consistent and we have been moving in a downward channel without any kind of deep retracement which shows the fact that this bearish trend is very strong and current price action doesn't suggest that there are many big support level that can stop this bearish trend. I'm still expecting this trend to press lower and to retest the all time swing low level at 0.7100.
In Figure 1 we have the CAD/CHF weekly chart where we can visualize how sloped this down move has been especially during last year. There are still more than 800 pips until we reach the last swing low. We can also see that this down sloped move only accelerate after we broke the red line, 0.9400 level which was a strong pivot point acting as both resistance and support level in the past.

Figure 1. CAD/CHF Weekly Chart.
Below in Figure 2 we have the CAD/CHF daily chart where we can have a closer look at how smooth the move inside the downward channel was. As long as we stay withing the boundary of this channel the downtrend will stay intact. In this environment is very hard to have a clear view on how the wave count based on Elliott Wave theory should look like. However we can look at other tools to analyse the current price action and we can see how each previous swing low or support level after has been broken out is acting as resistance when we retest that broken level. This only tells us the force of the current bearish trend and the fact that the downside momentum should continue to the downside.
Figure 2. CAD/CHF Daily Chart. Downward Channel.
Based on my forecast and my projections we should see an exchange rate for CAD/CHF of 0.7785 for 2nd of Jun.Best Regards,
Daytrader21


