Still confused about XXX/JPY sell of? Read my blog. If you're confused about recent development in XXX/JPY pairs let me bring some light on what's happening currently with yen pairs. I've been forecasting this retracement in the xxx/jpy pairs since last year, you can check out my blog post here: FX Market Outlook - JPY (part 1)


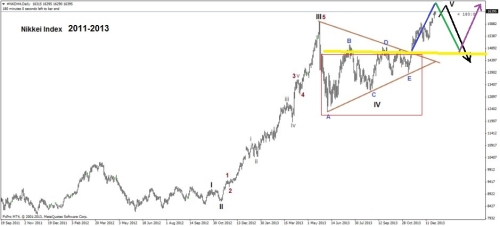
I have also indicate that Nikkei index should see a retracement and this was the catalyst for the recent strength in JPY pairs. In Figure 2 you can see first chart is Nikkei index posted last year with my forecast. Second chart is the the 1989 Nikkei fractal chart which is guiding today's price action. Third chart is the most recent Nikkei's price action. Just compare current price action with what happened in 1989 although in the current phase we retrace more than expected the current model is still valid.
Nikkei has just stopped at 61.8 fib level which should provide good support level and this can be the trigger for the next up leg in XXX/JPY. But that doesn't mean that we can't see new marginal lows in XXX/JPY pairs before to resume the current up trend.
Best Regards,
Daytrader21.

- Figure 1. 1989 USD/JPY fractal for today's price action.


- Figure 2. Nikkei 225 Index Recent Price action and 1989 Fractal.
I have also indicate that Nikkei index should see a retracement and this was the catalyst for the recent strength in JPY pairs. In Figure 2 you can see first chart is Nikkei index posted last year with my forecast. Second chart is the the 1989 Nikkei fractal chart which is guiding today's price action. Third chart is the most recent Nikkei's price action. Just compare current price action with what happened in 1989 although in the current phase we retrace more than expected the current model is still valid.
Nikkei has just stopped at 61.8 fib level which should provide good support level and this can be the trigger for the next up leg in XXX/JPY. But that doesn't mean that we can't see new marginal lows in XXX/JPY pairs before to resume the current up trend.
Best Regards,
Daytrader21.


