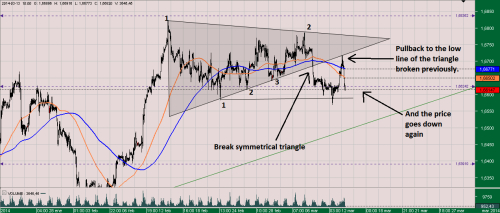
Technical analysis is used to identify patterns of behavior of the markets that have been recognized as significant. For many given patterns there is a high probability of occurring the expected results.They are also recognized patterns that repeat in a consistent manner.
It consists in the projection of future trends based on past trends and guidelines that have been in the graphics market.
One of the patterns of the technical analysis that trust give me are triangles, and this week in the GBP/USD pair can see the hourly chart the perfect example of how a triangle in technical analysis.


