Every time the US Dollar gets a bit of a lift, many trader's become extremely bullish the US Dollar calling a long term change in trend. I distinctly recall last year in May. The dollar made a marginal new high (monthly chart), and traders were piling on USD Longs.
The long term players are not going to be getting on this bandwagon. In fact, long term players are still looking at short the currency and will continue to do so.
There are two ways to look at this. Fundamentally & Technically.
From a fundamental perspective, there was arguments, once QE would start to taper, the Dollar would rise. Well, QE has been tapering for 5 months now. Not only has the dollar not gone up, it's in fact gone down!
There was the logic that the indexes were going to collapse. Fundamentalists, were saying that the excessive use of leverage would cause a massive sell off. They were calling a "the world is going to end" stock market crash. Why? I think because if it happened it would make them look good, because they called a top.
Real trader's don't trade that way. They look at the trend, and buy in the direction of the trend on dips. They DO NOT call tops and bottoms.
Still not convinced? Here are some charts, and you can decide for yourself.

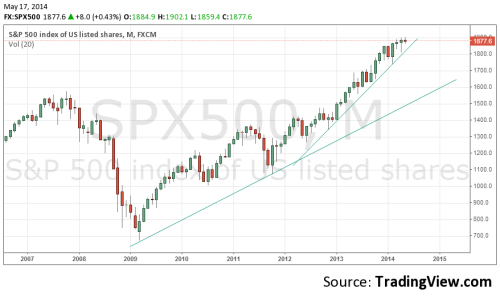
That's a chart of the S&P 500. Certainly does not look bearish. In fact, this is the type of trend trader's dream of. Now you see every red candle on the chart there? each time a red candle was posted, Social media was plastered with "the world is going to end" type statements that the S&P was going to crash. The smart trader ignored this "noise" and continued buying. And have profited quite nicely from it.
Here's another chart.

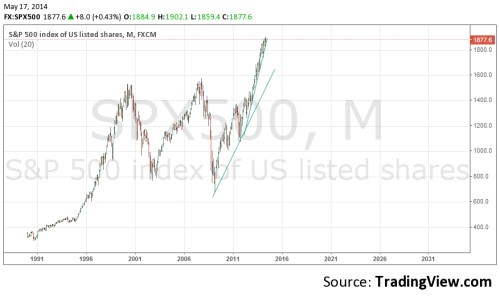
That's a zoomed out version of the S&P dating back to 1990, That trend is so strong I'm going to have to resize my chart to fit the upswing in there. Is it wise to try and call a top here? Should you be a seller? Even the most inexperienced Elliott Wave technician will tell you that's a Wave 3.
Now, here is the US Dollar index
 Without getting complicated or overly technical. Here are the facts.
So now we've been consolidating in that level for quite some time building up for the next big move. The fact that we've made new lows, is certainly not bullish. 81.25 is an important level on the longer time frames. But even if we trade above 81.25, we would want to see at least a clear break of 92.30. It's the next peak on the chart, and only then would we see bullish momentum kicking in.
I strongly favor the downside on this pair. After making new lows, I don't see any reason for a rally to the upside. The consolidation we've had for the last few years, looks like a triangle to me (2008-current), which in majority of cases break out in the direction of the trend, which is down.
The long term players are not going to be getting on this bandwagon. In fact, long term players are still looking at short the currency and will continue to do so.
There are two ways to look at this. Fundamentally & Technically.
From a fundamental perspective, there was arguments, once QE would start to taper, the Dollar would rise. Well, QE has been tapering for 5 months now. Not only has the dollar not gone up, it's in fact gone down!
There was the logic that the indexes were going to collapse. Fundamentalists, were saying that the excessive use of leverage would cause a massive sell off. They were calling a "the world is going to end" stock market crash. Why? I think because if it happened it would make them look good, because they called a top.
Real trader's don't trade that way. They look at the trend, and buy in the direction of the trend on dips. They DO NOT call tops and bottoms.
Still not convinced? Here are some charts, and you can decide for yourself.

That's a chart of the S&P 500. Certainly does not look bearish. In fact, this is the type of trend trader's dream of. Now you see every red candle on the chart there? each time a red candle was posted, Social media was plastered with "the world is going to end" type statements that the S&P was going to crash. The smart trader ignored this "noise" and continued buying. And have profited quite nicely from it.
Here's another chart.

That's a zoomed out version of the S&P dating back to 1990, That trend is so strong I'm going to have to resize my chart to fit the upswing in there. Is it wise to try and call a top here? Should you be a seller? Even the most inexperienced Elliott Wave technician will tell you that's a Wave 3.
Now, here is the US Dollar index
 Without getting complicated or overly technical. Here are the facts.
- Sometime in 1984 we posted a high, and have been trading downwards since then (20 years)
- In 1995 after hitting the 81.25 area 3 times, we started catching bids.
- In 2001 we hit a peak around 120. But that was just a pull back.
- In 2004 we hit that 81.25 area again. Retracing the entire bullish move to 120
- we bounce a bit and eventually break 81.25 to brand new lows.
So now we've been consolidating in that level for quite some time building up for the next big move. The fact that we've made new lows, is certainly not bullish. 81.25 is an important level on the longer time frames. But even if we trade above 81.25, we would want to see at least a clear break of 92.30. It's the next peak on the chart, and only then would we see bullish momentum kicking in.
I strongly favor the downside on this pair. After making new lows, I don't see any reason for a rally to the upside. The consolidation we've had for the last few years, looks like a triangle to me (2008-current), which in majority of cases break out in the direction of the trend, which is down.


