GBP/USD
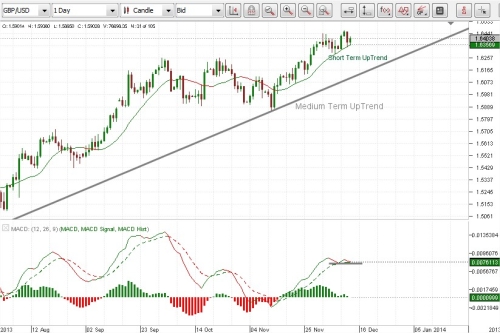
- Long Term Looking at the GBP/USD monthly chart we can see a sideways movement between levels 1,70 - 1,40. Since the minimum price of January 2012, we are ranging with top at 1,64 and bottom at 1,48. If we Break up 1,64 level, the path will be free to return to the top at 1,70 area. - Medium Term We have an ascending uptrend since we broke up the 1,58 level. If this trend continues we may breakout the 1,64 level. - Short term Also in uptrend, currently in a correction. At the moment we can see a potential hidden divergence on daily chart. If the price break up 1,64 level, the short term correction might have ended so i have a stop buy order above today's high.

- Long Term Looking at the GBP/USD monthly chart we can see a sideways movement between levels 1,70 - 1,40. Since the minimum price of January 2012, we are ranging with top at 1,64 and bottom at 1,48. If we Break up 1,64 level, the path will be free to return to the top at 1,70 area. - Medium Term We have an ascending uptrend since we broke up the 1,58 level. If this trend continues we may breakout the 1,64 level. - Short term Also in uptrend, currently in a correction. At the moment we can see a potential hidden divergence on daily chart. If the price break up 1,64 level, the short term correction might have ended so i have a stop buy order above today's high.


