 Open trading account
End of Day Update:
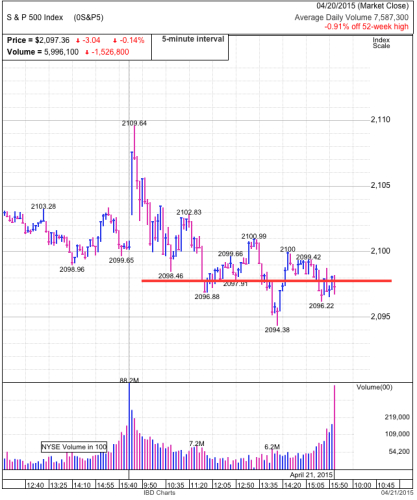
Stocks gave up early gains and finished near the lows of the day. The daily chart leads one to conclude this is weak, bearish price-action. But the intraday chart tells a different story. Most of the selling occurred in the first couple hours of the day after the market hit its head on 2,110 resistance. But, following the initial 11-point slide, we largely trade sideways for the remainder of the day and closed only one-point under the lows hit at 10:30am. The intraday chart contradicts the daily because it shows supportive price-action as few owners joined the morning’s selloff. When the market is given a perfect invitation to selloff, yet hold firm, that is bullish price-action even if we finished in the red.
While we cannot read too much into one day, it suggests the next few points will be higher. That is as far as this analysis can take us. We will have to reevaluate sentiment and price-action once the market tests prior highs near 2,120 before deciding to buy the breakout or sell the strength.
Cheers !
