 Last time I've spoke about EUR/USD was on my latest webinar, that I had to do after coming in the second place in Article contest, and I spoke in more details about the chart I posted in this blog post: FED tappers Effect
Although the chart I posted suggested you should go long EUR/USD, the trade was only good for 100 pips, but on my webinar I've said that we also need a weekly close above 1.3800 which we have not, so that trade was invalidated but still you could have made 100 pips.
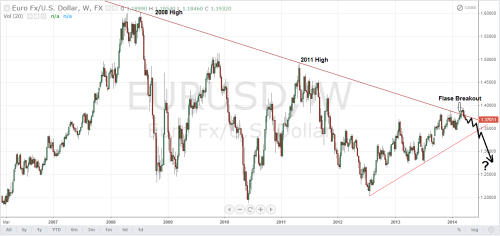
Also , my second remark was that if we don't close above 1.3800 this is a counter trade signal as it suggest we had a false breakout above the trend line that connect the 2008 and 2011 highs (see Figure 1).
- EUR/USD Fundamentals
On the one hand we have Fed moving away from his easing cycle, which sent soaring the expectation of interest rates raise in the second half of 2015. Also we have to take in consideration that Yellen have said at one point that the Fed will end its bond-buying program by the end of the year and secondly she said that the Fed will wait six months after the bond-buying program ends before raising short-term interest rates.

Figure 1. EUR/USD Weekly Chart (click on figure to enlarge).
On the other hand we have ECB which has to fight a prolonged deflation threats, as the consumer inflation figures has hit a 4 year low. Last week we also saw Draghi giving some hints that they're taking in consideration other available monetary policy tools like: negative deposit rate and QE which should send EUR/USD down as well. But their resilience to act quicker may keep EURUSD balanced for the time being and still move in a tight congestion zone.
The higher the EUR/USD exchange rate goes the greater the destructive force of deflation among higher Debt countries will be, which in turn will make more expensive to payback all the previous debt. This in itself is another factor that will lead and force ECB to engage in some aggressive easing and to use different tools to bring down EUR/USD exchange rate. I believe this will lead to a massive EURO devaluation for this is the only chance to escape the Debt-Deflation spiral.
- EUR/USD Technicals
Here I'm going to use CitiFx Technical Research charts because we basically have the same view just that CitiFx gives a more in depth chart analysis, but I'm going to give my own outlook on those charts. In Figure 2 you can see the similarity between what has happened 30 years ago in the market with what is happening in now days. There are 3 main distinct phase with this chart:
- The 91 months uptrend between 1985-1992 similarity with the 93 months uptrend between 2000-2008 (green line).
- Exchange Rate Mechanism(ERM) sideways action between 1992-1997 similarity with the sideways action between 2008-2012 (red line).
- The 16.5% rally within the downtrend from 1997-1998 similarity with 16.0% rally between 2012-2014 (blue line).

Figure 2. EUR/USD Long Term Chart.
This is basically a fractal that suggest EUR/USD can follow the price action path from 30 years ago, you can see that some phases are developing in some cases at different time scale but this is the nature of fractals. The final stage of this fractal suggest that we'll follow the fractal either in time or either in price:
- Time: After the 16.5% rally we topped in October 1998 than we sold of for 25 months until the 0.8225 bottom. But we only change the trend after we broke to the upside in Jun 2002 so this makes in total 44 months, however we should keep in mind both numbers for signs of bottom.
- Price: After we topped in October 1998 we had an -34% sell of or devaluation of the euro which means that if we would have that kind of move, we should see EUR/USD below parity at around 0.9200 exchange rate.

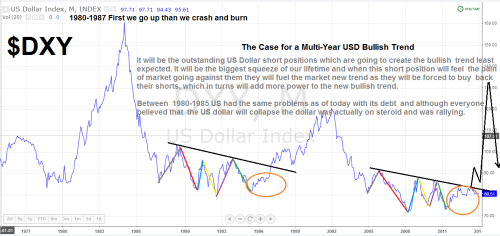
Figure 3. US Dollar Index Chart.
This whole analysis also come in line with my overall US Dollar view, I've made an extensive blog post 3 months ago about my expectation when it comes with the US dollar: The Case for a Multi-Year USD Bullish Trend
The same as in the case of EUR/USD I'm using a fractal to track down the recent price movement in USDX, and futures projections (see Figure 3).
Best Regards,
Daytrader21.


