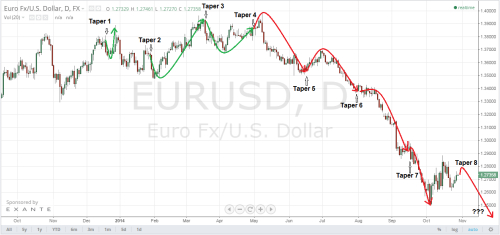
I've posted this chart and analysis of EUR/USD on my linkedin page last week just before the FOMC statement and I would like top post that analysis here as well as this chart as been a great map for those how traded EUR/USD this year.
This is the final update of the famous EUR/USD tapering effect chart which has been providing a great map to trade EUR/USD over the last few months. Last time I spoke about it was here: EUR/USD FED Taper Effect.

Today's FOMC statement should be critical in term of the FED languages. If FED decided to keep the "considerable time" stance in the statement, which shows FED unwillingness to ,move too fast towards rate normalization cycle in which case we can expect a moderate dollar sell off which should provide us a good opportunity to re-enter long dollar positions.
Also any upgrade on the economic forecast can provide some volatility if either FED decide to downgrade the economic forecast or not due to recent deflationary concerns. If FEd is optimistic about growth this will be bullish for the dollar and than EUR/USD will go straight down.
It will all come down to FED language but also price history and previous market reaction to FED Tapering can be a guide for us (see Figure 1). You can now see the outcome and how it played out and as expected it has followed my forecast.
Best Regards,
Daytrader21
This is the final update of the famous EUR/USD tapering effect chart which has been providing a great map to trade EUR/USD over the last few months. Last time I spoke about it was here: EUR/USD FED Taper Effect.

Figure 1. EUR/USD Tapering Effect
Today's FOMC statement should be critical in term of the FED languages. If FED decided to keep the "considerable time" stance in the statement, which shows FED unwillingness to ,move too fast towards rate normalization cycle in which case we can expect a moderate dollar sell off which should provide us a good opportunity to re-enter long dollar positions.
Also any upgrade on the economic forecast can provide some volatility if either FED decide to downgrade the economic forecast or not due to recent deflationary concerns. If FEd is optimistic about growth this will be bullish for the dollar and than EUR/USD will go straight down.
It will all come down to FED language but also price history and previous market reaction to FED Tapering can be a guide for us (see Figure 1). You can now see the outcome and how it played out and as expected it has followed my forecast.
Best Regards,
Daytrader21


