 This blog post it's a continuation from last time I talked about the US Dollar, but in the meantime I wrote an Article talking there in more details about this issue, go check it out here: US Dollar Macro and Technical View
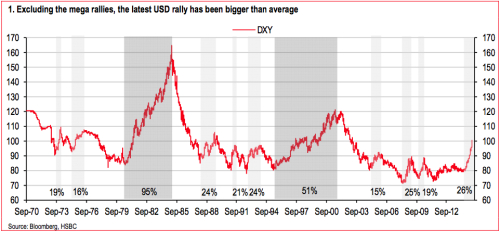
It's not unrealistic for the dollar to continue rallying as there have been other instances in the past in which case the dollar rally has extended past 50% mark (see Figure 5). Actually the dollar trade weighted cycles tend to last on average 8 years and we have still a long way to go. Many traders wrongly assume that because we have gone up in such a strong fashion way, we must go done.
But it's like in the physics laws of motion which state that a trend in motion will tend to continue in motion until a major event take place that would cause it to change its direction. So if you're looking at the chart and see momentum increasing and price making new highs, the odds are that higher prices will probably follow as momentum tends to accelerate as the trend develops.

Figure 5. DXY average 8 year Cycle
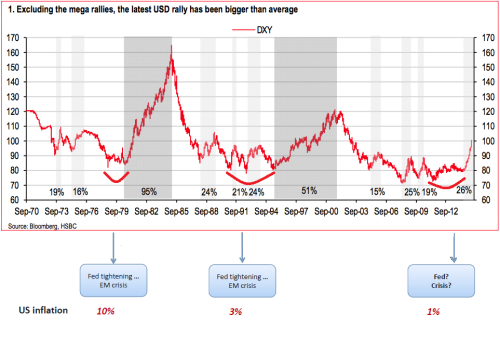
The Us Dollar move in big cycle tend to trade well above the 50% mark, we have two instances in the past (see Figure 6) that can serve as a road map for what may lie ahead of us:
- In 1980-1985 a staggering 95% rally which culminate with the creation of G5 and the biggest devaluation of the dollar(Plaza Accord).
- The 1995-2001 period produced a 51% rally, which was the trigger for the Asian Currency Crisis.

Figure 6 . DXY Advances expressed in %.
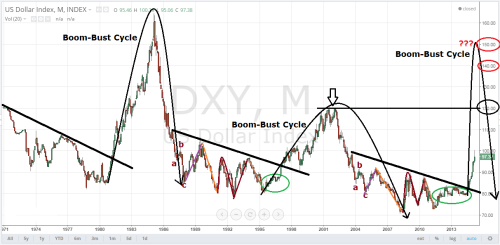
This business cycle is a reflection of the boom-bust cycle which is unfolding right in front of our eyes.
Taking in cosideration all my previous arguments we can strongly assume we're going to break above last swing high at around the round number 120.00 established in 2001. We can also tell that every major bull trend has started with the break of a TL(see Figure 7). The majority of the newly-developed trends have one thing in common: a broken trend-line from a previous trend. I wrote about this issue in more detail in my January article, you can find more here: Trend Trading Strategy: Departure Trendline Setup

Figure 7. DXY Monthly chart
Best Regards,
Daytrader21


